Bid Spread Test: Detect Broker Collusion in 20 Minutes (Dry Bulk)
Key Takeaways
- What the spread test does not tell you
- The Capesize and Panamax numbers
- The audit trail problem that compounds this
- One objection worth addressing directly
- Related articles
Pull the last 30 tenders from your records. Calculate the spread between the highest and lowest offer on each — excluding outliers more than 30% above median. Average those spreads.
If the number is below 6%, your brokers are not competing. They are coordinating.
This is not a suspicion or a theory. It is a measurable structural outcome of how information moves in a small market. Dubai, Geneva, Singapore, Rotterdam — the broker communities in each hub number 20 to 40 active players. They know each other. They work together on other deals. When five of them receive the same email tender simultaneously, the market signal is immediate and the informal calibration begins before a single offer is submitted.
Genuine independent assessments of the same route diverge. Brokers have different vessel positions, different shipowner relationships, different cost structures. A 12–18% spread is what competition looks like. A 2–4% spread is what a coordinated floor looks like.
What the spread test does not tell you
The spread test identifies coordination. It does not identify the mechanism, and conflating the two is a mistake that leads to the wrong remedies.
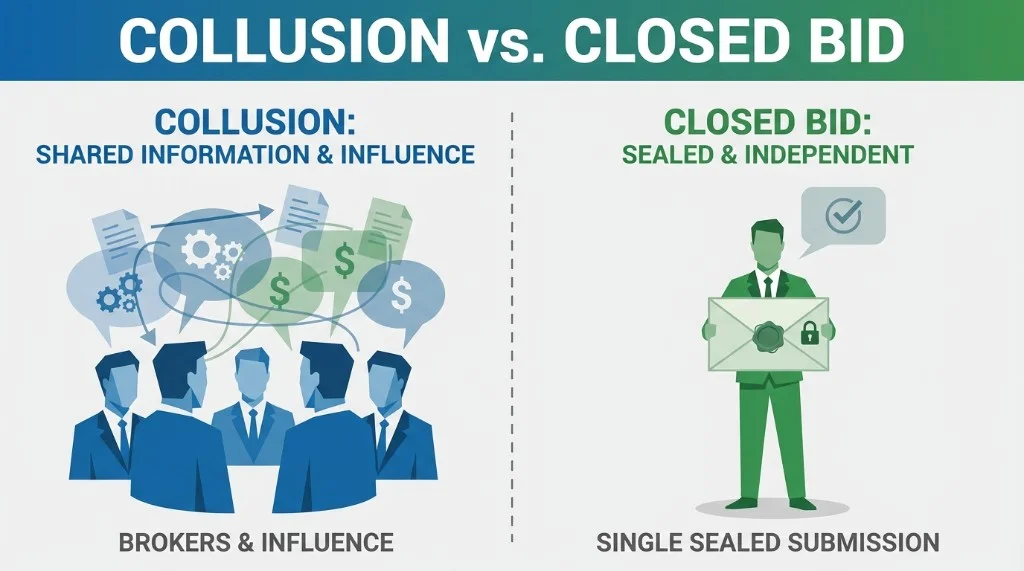
Explicit collusion — brokers agreeing on rates before submitting — is relatively rare and legally exposed. What you are almost certainly seeing is implicit coordination: brokers independently making rational decisions based on shared intelligence. The tender email was forwarded. A shipowner contact was called. Someone checked with a colleague who handles the same trader's other desk.
The distinction matters because the remedy for explicit collusion is legal action. The remedy for implicit coordination is structural: remove the information that enables it.
The Capesize and Panamax numbers
The published "meaningful rate gaps vs email baselines" figure applies across the full spectrum of vessel sizes. For freight directors running Capesize volumes, the absolute exposure is different in magnitude.
A Richards Bay–Qinhuangdao Capesize fixture: 170,000 mt at $17/mt = $2.89M. A 15% coordination premium on that fixture is $433,000. At 18 Capesize tenders per year, the annual exposure is $7.8M. That is not a procurement efficiency gap. That is a structural leak in your P&L.
Panamax: 75,000 mt at $21/mt = $1.575M. 15% premium = $236,000. At 60 Panamax tenders per year: $14.2M.
These numbers assume the conservative end of the coordination premium range. Desks operating in tight hub markets, with broker panels below 10 and email as the primary channel, are at the upper end.
The audit trail problem that compounds this
Most freight directors understand the rate problem. Fewer have mapped the compliance exposure that sits underneath it.
When a regulator — DMCC compliance review, MAS AML inquiry, FINMA audit — asks for documentation of a freight procurement decision, what you need is not an explanation of what happened. You need a contemporaneous, timestamped, unalterable record of: who was invited, when each offer was received, what each offer contained, and the documented rationale for the award.
Email provides none of this reliably. Email threads can be deleted, selectively forwarded, or reconstructed after the fact. The audit log that regulators expect to see does not exist in any email-based process.
The compliance exposure is not theoretical. DMCC's 2024 guidance on procurement documentation explicitly references the expectation of "a competitive process that can be evidenced." The practical standard is an immutable record — not a folder of emails.
One objection worth addressing directly
The most common internal resistance to closed-bid platforms is from traders who have longstanding broker relationships and are concerned about friction. This is legitimate, not irrational.
The answer is empirical: run the next five tenders through a closed-bid process and compare the results to the equivalent five email tenders. Across every desk that has run this comparison, the rate improvement appears on the first tender. Not because the relationships change — but because the information structure changes. The broker submitting through a sealed process cannot calibrate against what others are bidding. So they bid based on their actual cost structure.
That is what competition is. The relationship survives. The coordination premium does not.
FreightTender runs closed-bid tenders for commodity and chemical trading desks. Get a 10-minute RFQ leakage audit →
Related articles
- How informal bid signalling Costs Commodity Traders $1M+ Annually
- Closed-Bid Freight Tendering: Why Sealed Offers Beat Email Tenders
- Freight Tendering Compliance: Dubai, Geneva & Singapore
Find leakage in your brokered freight RFQs
Bring one recent RFQ. We map offer comparison, benchmark gap, timing risk, and award record — no commitment.
Run the bid spread test on your next review
Closed-bid tendering removes the information structure that produces narrow spreads. See a 15-minute FreightTender walkthrough.
Build your trading vocabulary
Commodity & Freight Trader's Lexicon
200+ Anki flashcards per deck — charter party clauses, laytime, FOB/CIF, indices, and desk terminology. Instant download after checkout on Gumroad.